 The claim
“The figures demonstrate clearly that universities’ significant efforts to widen participation to higher education are making a real and lasting difference to thousands of lives.”
Professor Les Ebdon, 23 July 2013
The background
The latest figures from Ucas on trends in university applications contained some surprises.
Most news outlets seized on the news that white teenagers are now less likely to apply to university than youngsters from any other ethnic group.
That doesn’t mean white teens are doing particularly badly – it’s more that black school-leavers have overtaken them in recent years, as our graphic shows.

Applications from all ethnic groups have risen, but the rise has been fastest among black pupils (these figures are for English state school pupils aged 18).
Ucas, the government and Professor Les Ebdon, director of the Office for Fair Access quango, were all keen to point out that the gap between rich and poor is apparently closing too. Is that right?
The analysis
This is the key graph. The red line at the bottom represents young people from the most deprived areas of England.
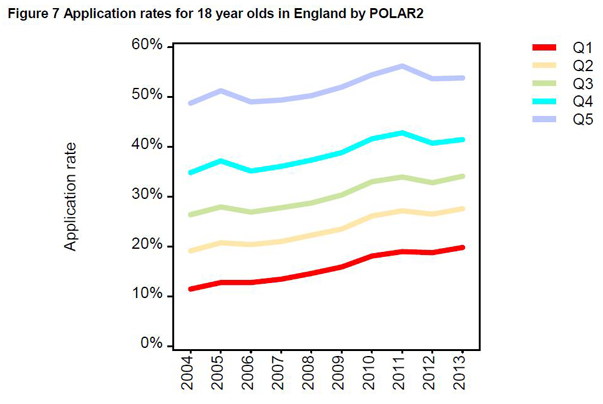
Fewer people from this group apply for a place at university than any other, as you might expect.
But things appear to be changing: the red line is going up, and faster than any of the others.
Ucas says the largest increases are for young people from the most disadvantaged backgrounds, adding: “The application rate of young people living in the most disadvantaged areas has increased by over 70 per cent (proportionally) between 2004 and 2013.”
This means 18-year-olds living in the most advantaged areas are only 2.7 times more likely to apply for higher education than those in the most disadvantaged areas, as opposed to 4.3 times more likely in 2004.
There are two reasons why this may be an overly optimistic view of how successful we have been in widening access to higher education.
The first is that Ucas is using a methodology that is becoming increasingly out of date.
It’s using something called Polar (participation of local areas) 2 – a way of dividing up the country into different areas based on how many people who live there go on to university.
Participation in higher education is assumed to be an indicator of socioeconomic deprivation, and neighbourhoods are divided into five quintiles, from the most to least deprived.
But the analysis of different areas was done in 2007, and of course the character of neighbourhoods can change rapidly.
The system was updated last year with the introduction of Polar 3, based on the latest information on who went to university and where they were from.
Nevertheless, Ucas has stuck with Polar 2. The advantage of this is that it lets you look at long-term trends over the last decade.
The disadvantage is diminishing accuracy over time. A neighbourhood that was among the most deprived ten years ago might have become gentrified since then.
The second and most important point is that Ucas tracks people who apply to university, not people who actually go there.
Fortunately we have an alternative source of figures on real students, courtesy of the Higher Education Statistics Agency (Hesa). Hesa’s numbers represent people from the most deprived areas who actually enrol on a university course and stick it out for at least two weeks.
Hesa prefers to swap to Polar 3 to 2009/10 – that’s the change from red to green in this graph – which makes things more accurate but rules out long-term comparisons.

But note that wherever you zoom in, the picture here is a lot less rosy than the one painted by the Ucas stats.
Let’s not be too negative: there are signs of increasing participation, but it’s a painfully slow, incremental change. The latest increase on record, from 2010/11 to 2011/12, is just 0.2 percentage points.
If we want to find a historical trend, it is possible to do what Ucas does and just use Polar 2 figures, but for actual university entrants, not just people who apply.
This gives us a rise in the percentage of English university entrants from low-participation areas from 9.2 per cent in 2005/06 to 10.7 per cent in 2011/12.
Again, this is consistent change but the pace is incredibly slow – an average of less than 0.3 percentage points a year.
These Polar things are only one way of measuring deprivation. Hesa look at two other benchmarks: the number of students who went to state schools, and their social class, based on their parent’s occupation.
Here’s the percentage of young people studying for the first degree who went to a state school:

And here’s how the percentage of young students from the lowest socioeconomic classes changes over the years:

Notice any similarities? Again, there is some evidence of widening access, but it’s happening at a snail’s pace.
Ucas uses an alternative measure of poverty too – the number of applicants who were eligible for free school meals. In 2006 just over 9 per cent of applicants were in that category. In 2013 it was nearly 15 per cent.
That’s quicker progress than we find in the Hesa figures, but is less impressive than Ucas’s preferred measure. Hesa doesn’t look at free school meals, so we don’t know what happens if you look at people who actually made it to university, rather than just applied.
The verdict
There is evidence of widening participation in higher education among the poorest, but let’s not pop the champagne cork just yet. Ucas deal in applications to university and they don’t track what happens afterwards.
Alternative measures of real student numbers suggest that we are making very slow progress in opening up access to the dreaming spires.
By Patrick Worrall


